Table of contents
- Quick summary
- Why a first-scan cohort says something a snapshot cannot
- Methodology: how the cohorts were built
- The raw table: every first scan, by month
- What made August look good: returning hosts
- What happened in September: busy days, and a dip that survives without them
- The clean series: hosts never scanned before
- Within one platform: Next.js and WordPress
- What the numbers do and do not support
- Why the two files spread at different speeds
- What would change this reading
- How to check where your own site stands
- Common mistakes when reading adoption trends
- The next action
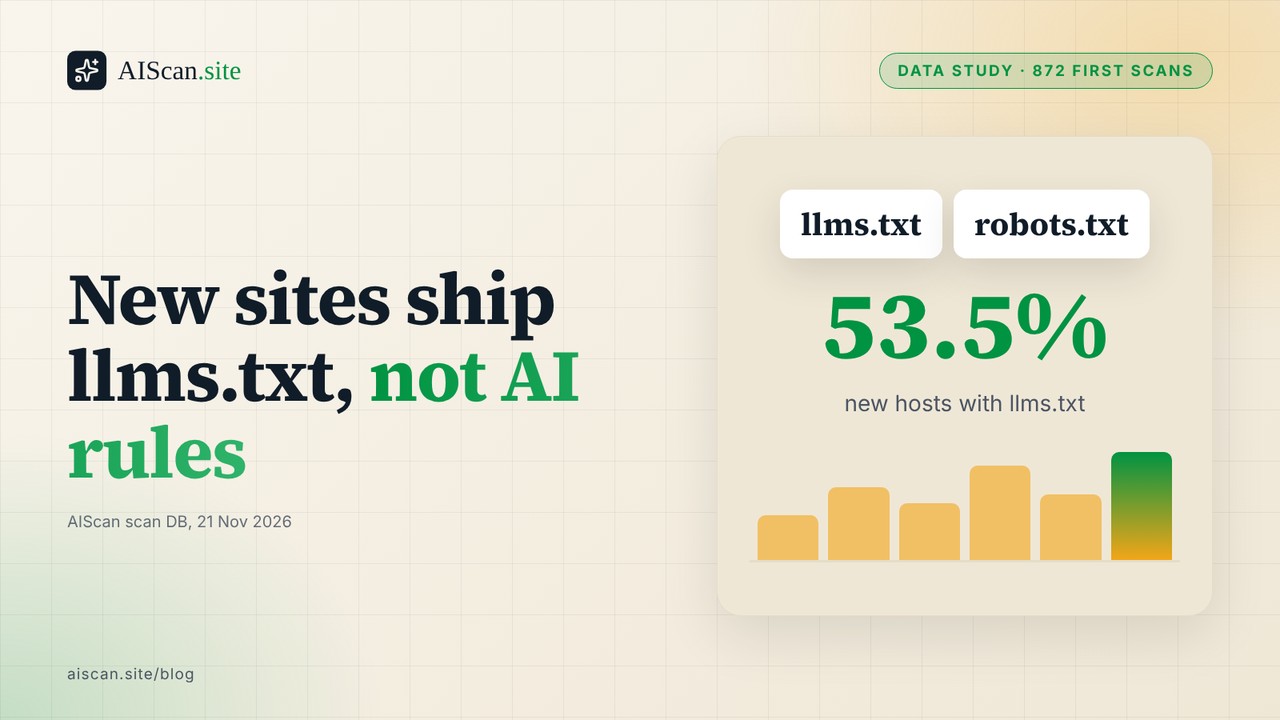
Direct answer: Among sites our scanner had never seen before, the share passing the llms.txt check went from 29.5% in August and September 2026 to 53.5% in October and November. Over the same months the share declaring Content Signals in robots.txt fell from 15.8% to 8.6%, and the share naming at least one AI crawler in robots.txt stayed flat at about 22%. New sites are arriving with llms.txt files; they are not arriving with AI rules in robots.txt.
The adoption figures that get quoted for llms.txt and AI crawler rules are usually one snapshot, or a count of files across a crawl. Our scan database can do something a snapshot cannot: group every host by the month it was first scanned, on one fixed rubric, and compare the cohorts. This article does that for 872 hosts first scanned between 24 August and 21 November 2026, and explains the September dip that made the raw numbers look stranger than they are.
Quick summary
| Question | Answer | Source |
|---|---|---|
| How many hosts? | 872 first scans on rubric 2026.08.2: August 243, September 426, October 129, November 74 (to the 21st) | Our scan DB, first site scan per host, queried 21 Nov 2026 |
| Did llms.txt spread? | Yes. C2 pass on never-seen hosts: 33.3%, 26.7%, 54.0%, 52.8% by month | Same query, 622 never-seen hosts |
| Did Content Signals spread? | No. B1 pass on never-seen hosts: 18.1%, 14.2%, 7.1%, 11.1% | Same query |
| Did named AI bot rules spread? | No. B2 pass on never-seen hosts: 26.6%, 21.1%, 20.6%, 25.0% | Same query |
| Why does August look so good in the raw data? | 66 of its 243 hosts had been scanned before on an older rubric and averaged 75.5 points | Same query, prior-scan flag |
| Is September an artefact of batch scanning? | Partly. 11 busy days account for 565 first scans, but September's quiet days score as low as its busy ones | Same query, first scans per day |
| Mean first-scan score of never-seen hosts | 48.2, 47.2, 53.0, 51.3 | Same query |
Why a first-scan cohort says something a snapshot cannot
A snapshot such as our State of AI Agent Readiness in 2026 mixes sites that arrived in August with sites that arrived last week, and sites that have been rescanned and fixed with sites scanned once. The rescan study answers a different question: what happens to the same host when it comes back. Neither tells you whether the sites showing up for the first time today are in better shape than the sites that showed up in August.
The first scan is the cleanest measurement we have of a site before AIScan's own fix guidance has touched it. If the first-scan pass rate on a check climbs month after month, that check is spreading among the kind of site whose owner looks for an AI-readiness scan. If it stays flat, the file or rule is not spreading, however much it is discussed.
That makes the cohort view a decent proxy for what site owners are shipping on their own. It is still a proxy, for a reason the methodology section spells out: the people who scan their site are not a random sample of the web.
Methodology: how the cohorts were built
Every number below comes from aggregate SQL run against the AIScan production database on 21 November 2026, at about 03:10 UTC. No individual host is named, and no row was selected.
- Rubric fixed at 2026.08.2. Only site-scope scans graded on rubric version 2026.08.2 are counted. That rubric has not changed since its first scan on 24 August 2026, so a pass in August and a pass in November mean the same thing. Scans on the two earlier rubrics (from 23 June) are left out of the counts.
- One first scan per host. Hosts are the URL's hostname, lower-cased. For each host the earliest 2026.08.2 site scan is kept and assigned to its calendar month (UTC).
- Our own site removed. aiscan.site is excluded, as in every corpus study on this blog.
- A prior-scan flag. A host is "never seen" if it has no scan of any kind, on any rubric, before its first 2026.08.2 scan. 622 of the 872 hosts qualify. The other 250 had been scanned on an older rubric and came back.
- A busy-day flag. No October or November day produced more than 13 first scans. The 11 days in August and September that produced 15 or more are marked "busy" (565 first scans between them).
Statuses are the scanner's own. C2 passes when /llms.txt returns a 200 file shaped like the llms.txt proposal, which in its own words proposes "adding a /llms.txt markdown file to websites to provide LLM-friendly content". B1 passes when robots.txt carries a Content-Signal line as defined at contentsignals.org, which, fetched from the site on 21 November 2026, describes itself in its own words as "an up-to-date guide to the IETF's proposed new AI Preferences (aipref)"; when it does not, the scanner records info, not fail, because the check is optional. B2 passes when robots.txt addresses at least one known AI crawler by user-agent. The full definitions are on the content checks and bot access checks pages.
The raw table: every first scan, by month
This is the table a quick query produces, and it is the one that looks odd.
| Check | August (243) | September (426) | October (129) | November (74) |
|---|---|---|---|---|
| C2 llms.txt | 46.9% | 32.9% | 53.5% | 54.1% |
| C3 structured HTML | 53.5% | 41.3% | 65.9% | 60.8% |
| B1 Content Signals | 23.0% | 15.7% | 7.8% | 12.2% |
| B2 named AI crawlers | 37.0% | 25.6% | 21.7% | 25.7% |
| C1 Markdown copy | 28.4% | 22.8% | 20.9% | 23.0% |
| D3 Link header or head link | 55.6% | 42.5% | 56.6% | 48.6% |
| D1 robots.txt | 71.2% | 68.3% | 78.3% | 77.0% |
| D2 sitemap | 76.1% | 72.8% | 79.8% | 77.0% |
| E3 server-rendered text | 71.2% | 68.5% | 76.0% | 71.6% |
| P4 OAuth metadata | 15.2% | 9.9% | 12.4% | 12.2% |
| P2 MCP server card | 4.5% | 1.9% | 2.3% | 1.4% |
| Mean score | 55.6 | 50.7 | 53.3 | 52.0 |
Read naively, almost everything got worse from August to September and then recovered. A real web does not lose and regain a third of its llms.txt files in eight weeks. Two things in the population explain most of the shape, and the next two sections take them in turn.
What made August look good: returning hosts
Rubric 2026.08.2 went live on 24 August. Sites that had been scanned on the older rubrics during June, July and August were scanned again on the new one in its first days, and each of those rescans counts as the host's "first" 2026.08.2 scan. They are not first-time visitors.
| Cohort | Hosts | Had an earlier scan | Mean score, never seen | Mean score, returning |
|---|---|---|---|---|
| August | 243 | 66 | 48.2 (177) | 75.5 (66) |
| September | 426 | 179 | 47.2 (247) | 55.6 (179) |
| October | 129 | 3 | 53.0 (126) | 65.0 (3) |
| November | 74 | 2 | 51.3 (72) | 75.5 (2) |
The 66 returning hosts in August averaged 75.5 points. Many had been scanned, fixed and scanned again, which is exactly what our repeat-scan study found sites do. They pull August's raw mean up to 55.6 and its llms.txt pass rate to 46.9%. Taken alone, the 177 hosts we had never seen before scored 48.2 and passed C2 at 33.3%.
September's 179 returning hosts are a different crowd: their mean is 55.6, closer to the newcomers. Most of them arrived on a single day, 1 September, which brings us to the second effect.
What happened in September: busy days, and a dip that survives without them
Eleven days in late August and September carried 15 or more first scans each, more than any day since. The largest was 1 September with 190 first scans, 152 of them hosts with an older scan, so a batch rescan of known sites. Two more stand out: 30 August (86 first scans) and 13 September (60, of which only 8 passed C2).
| Group | Hosts | Mean score | C2 pass | B1 pass | B2 pass |
|---|---|---|---|---|---|
| Busy days, August | 238 | 55.6 | 47.1% | 22.7% | 37.0% |
| Busy days, September | 327 | 52.0 | 32.7% | 17.4% | 27.8% |
| Quiet days, September | 99 | 46.7 | 33.3% | 10.1% | 18.2% |
| October (no busy days) | 129 | 53.3 | 53.5% | 7.8% | 21.7% |
| November (no busy days) | 74 | 52.0 | 54.1% | 12.2% | 25.7% |
The scans table does not record which surface sent a scan, so we matched each first scan to the nearest entry in our request log within two minutes. On September's busy days the nearest request was an API call for 182 of 327 first scans; on its quiet days, for 16 of 99. That is an approximation, not a join on an id, but it fits batch submissions through the public API rather than people pasting a URL.
The useful finding is in the third row. September's quiet days, 99 hosts arriving at an ordinary pace, passed C2 at 33.3% and averaged 46.7 points: no better than the busy days. So the batches explain the volume of September, and the returning hosts explain the height of August, but neither explains why September's newcomers were weaker than October's. We checked one more possibility. If a scanner fault had refused connections that month, C2 fails would show blocked status codes; instead 194 of September's 239 C2 fails were a plain HTTP 404, the same share as other months (96 of 116 in August, 42 of 51 in October). The files were absent.
The platform mix moved a little. Hosts our fingerprinting could not identify made up 39.2% of September against 32.9% of August and 33.3% of October (November is back at 39.2%), and they score lowest. That shifts the average a little, but it does not account for the within-platform drop in the next section.
The clean series: hosts never scanned before
Removing every host with an earlier scan leaves 622 hosts that reached us for the first time on the current rubric. This is the table to quote.
| Check | Aug (177) | Sep (247) | Oct (126) | Nov (72) | Aug+Sep → Oct+Nov |
|---|---|---|---|---|---|
| C2 llms.txt | 33.3% | 26.7% | 54.0% | 52.8% | 29.5% → 53.5% |
| C3 structured HTML | 44.6% | 39.7% | 65.1% | 59.7% | 41.7% → 63.1% |
| C1 Markdown copy | 14.7% | 15.0% | 21.4% | 22.2% | 14.9% → 21.7% |
| D1 robots.txt | 65.0% | 64.0% | 78.6% | 76.4% | 64.4% → 77.8% |
| D3 Link header or head link | 44.6% | 39.3% | 56.3% | 47.2% | 41.5% → 53.0% |
| B1 Content Signals | 18.1% | 14.2% | 7.1% | 11.1% | 15.8% → 8.6% |
| B2 named AI crawlers | 26.6% | 21.1% | 20.6% | 25.0% | 23.3% → 22.2% |
| P4 OAuth metadata | 6.2% | 8.5% | 11.9% | 11.1% | 7.5% → 11.6% |
| Level 4 or 5 | 16.9% | 16.2% | 22.2% | 20.8% | 16.5% → 21.7% |
| Mean score | 48.2 | 47.2 | 53.0 | 51.3 |
Three patterns hold across both halves of the split:
- llms.txt went from a minority file to a majority file among newcomers. 125 of 424 new hosts passed C2 in August and September, 106 of 198 in October and November. The jump is large against the sample sizes: even November's 72 hosts on their own sit near 53%.
- Content signals went the other way. The share of new hosts with a
Content-Signalline roughly halved, from 67 of 424 to 17 of 198. According to our Content Signals adoption study, 117 of 799 sites declared one on 2 November; the cohort view says the newest arrivals carry it least. - Named AI crawler rules did not move. About one new host in four or five addresses an AI crawler by name, in every month. Robots.txt itself got more common (D1 64.4% to 77.8%); the AI section inside it did not.
Within one platform: Next.js and WordPress
Platform mix cannot explain a rise that happens inside a platform. This table uses every first scan (returning hosts included, because the per-platform groups get small), for the two platforms with enough hosts in every month.
| Platform, C2 pass | August | September | October | November |
|---|---|---|---|---|
| Next.js | 27 of 63 (42.9%) | 31 of 92 (33.7%) | 28 of 42 (66.7%) | 12 of 18 (66.7%) |
| WordPress | 31 of 58 (53.4%) | 49 of 120 (40.8%) | 15 of 26 (57.7%) | 9 of 15 (60.0%) |
| Not identified | 29 of 80 (36.3%) | 35 of 167 (21.0%) | 15 of 43 (34.9%) | 10 of 29 (34.5%) |
Next.js first scans went from about four in ten with an llms.txt file to two in three. WordPress rose less, from a higher start, and sites we could not fingerprint did not rise at all. The Next.js change fits what a reader would expect if generators and starter templates had begun shipping the file by default, but our data cannot see how a file was made, so that stays a hypothesis. The November cells are small (18 and 15 hosts) and will move.
What the numbers do and do not support
| Claim | Supported? | Why |
|---|---|---|
| Newly scanned sites carry llms.txt more often than in August | Yes | 29.5% to 53.5% on 622 never-seen hosts, fixed rubric |
| Content Signals adoption is falling on the web | No | Our cohort is who chose to scan; it says the newest scanners carry it less, not the web |
| AI crawler rules in robots.txt are stuck | Among our newcomers, yes | B2 flat at 21% to 27% in every month |
| September sites were worse because of batch scans | Partly | Batches add volume; quiet-day September hosts were just as weak |
| The rise is caused by framework defaults | Not shown | The scan records whether a file exists, not who wrote it |
| November is final | No | 74 hosts to the 21st, a part month |
The honest reading is narrow. Among people who come to an AI-readiness scanner with a site we have never seen, llms.txt has gone from optional to normal in about two months, and robots.txt AI declarations have not followed. The robots.txt standard, RFC 9309, says, verbatim, that its rules "are not a form of access authorization"; a crawler reads them as a request. A site that wants to make a request about AI use still has to write it, and most newcomers have not.
That gap matters because the two files do different jobs. llms.txt tells an agent what is worth reading. robots.txt, with or without a Content-Signal line, tells a crawler what it may do with what it reads. Our comparison of llms.txt, robots.txt and sitemap.xml covers the division of labour in detail, and our review of whether llms.txt actually works covers the evidence on whether anyone reads it.
Why the two files spread at different speeds
The data shows the gap; it does not show the cause. Three explanations fit what we see, and each one is something a later study could test.
llms.txt is additive; robots.txt is shared. Publishing /llms.txt adds a file nobody else on the site depends on. Editing robots.txt changes a file that search engines already read, and a wrong line there can remove a site from search. An owner with a deadline is more likely to add the first than to touch the second. The scan data fits this: D1, a working robots.txt, rose among newcomers (64.4% to 77.8%) while the AI rules inside it stayed flat, so more sites have the file and the same small share use it for AI.
Content Signals asks for a decision. A Content-Signal line states a position on training, search and AI answers. llms.txt states nothing of the kind; it is a reading list. Owners who have not decided where they stand on AI training have nothing to write, and the default of writing nothing scores info rather than fail in our scanner, so nothing in the report pushes them.
Some platforms own robots.txt. On hosted builders and some managed hosts, the owner cannot edit robots.txt at all, or can only add to a generated file. The share of hosts our fingerprinting could not identify was as high in November as in September (39.2%), and that group did not gain llms.txt either, which is what a platform limit would look like. We have not measured editability directly, so this one is the weakest of the three.
According to our State of AI Agent Readiness study, published 3 September on 473 sites, bot access was already the weakest of the five dimensions: mean 39.3, with 252 of 473 sites scoring zero on it. Three months of newcomers later, the cohort view says that weakness is not closing on its own.
What would change this reading
Four things would make us revise the conclusions above, and we will look for each when the study is re-run:
- A rubric change. If rubric 2026.08.2 is replaced, the months after the change are a new series and cannot be appended to this one.
- A fuller November. 74 hosts is enough to see the C2 level, not enough to call a turn in B1 or B2. A December cohort of similar size would settle whether B1 is recovering from its October low (7.1%) or not.
- A different visitor mix. If a large batch of first scans arrives through the API again, as in late August and September, the batch will be reported as a separate group, not folded into the month.
- A per-platform B2 rise. If Next.js or WordPress newcomers start naming AI crawlers at the rate they now ship llms.txt, the "stuck" verdict on B2 is wrong and the first section of this article will say so.
The queries that built every table are aggregate SELECTs over the scans table, grouped by the month of each host's first 2026.08.2 scan, with the prior-scan and busy-day flags described in the methodology. The rescan study uses the same population rules for the other half of the question: what a host does after its first scan.
How to check where your own site stands
Run a scan first. Paste your homepage at aiscan.site or run npx aiscan-cli yoursite.com (free, no account). The three checks this study tracks are C2 (llms.txt), B1 (Content Signals) and B2 (named AI crawlers); the report shows each with the evidence string the scanner recorded, the same field this study grouped.
If you would rather check by hand:
curl -s -o /dev/null -w '%{http_code} %{content_type}\n' https://yoursite.com/llms.txt
curl -s https://yoursite.com/robots.txt | grep -iE '^(content-signal|user-agent: *(gptbot|claudebot|google-extended|perplexitybot|ccbot))'
A 200 on the first line, and at least one User-agent line for an AI crawler on the second, is roughly what C2 and B2 look for. The scanner also checks the file's shape and counts the crawlers it knows.
To fix the gaps:
- llms.txt (C2). Generate a starting file with the free llms.txt generator, then follow the per-platform steps in llms.txt setup for every platform. On WordPress, ThinkRank writes llms.txt and robots.txt from one plugin, so two plugins are not competing over the same file, and it imports settings from Rank Math, Yoast, AIOSEO and SEOPress. Yoast, Rank Math, AIOSEO and SEOPress each document an llms.txt feature of their own.
- Named AI crawlers (B2). Add explicit groups for the crawlers you care about. The robots.txt starter for AI crawlers has a copy-ready block.
- Content Signals (B1). Add one line under the group it applies to. AIScan's own B1 guidance, fetched from its check-guidance tool on 21 November 2026, gives the example
Content-Signal: search=yes, ai-train=no, ai-input=yes, with the values you mean. AIScan treats B1 as optional, so a missing line isinfo, not a failure.
Then scan again and confirm the three checks changed.
Common mistakes when reading adoption trends
- Treating returning sites as new ones. August's raw 46.9% llms.txt figure is 33.3% once 66 rescanned hosts are removed.
- Blaming one month on batch scans without checking the quiet days. September's quiet days were as weak as its busy ones.
- Comparing across rubric versions. A pass on an older rubric is not the same test; this study uses one rubric only.
- Reading a scanner population as the web. These are sites somebody chose to scan, often while working on AI readiness.
- Quoting a part month as a month. November here is 74 hosts to the 21st.
The next action
Scan your site at aiscan.site or with npx aiscan-cli yoursite.com and read C2, B1 and B2 in the report. If C2 passes and B2 does not, your site matches the most common newcomer of the last two months: it tells agents what to read and says nothing about what they may do with it. Add the robots.txt block, scan again, and work through the remaining checks in order of impact on our guides page.
Frequently asked questions
Are newly scanned sites more AI-ready than in August 2026?
On llms.txt, yes. Among hosts AIScan had never scanned before, the C2 pass rate went from 29.5% in August and September to 53.5% in October and November, and the mean first-scan score rose from about 48 to about 52. On AI rules in robots.txt, no: Content Signals fell from 15.8% to 8.6% and named AI crawler rules stayed near 22%.
My site has llms.txt but AIScan still shows B2 failing. Why?
B2 reads robots.txt, not llms.txt. It passes only when robots.txt addresses at least one known AI crawler by user-agent, such as GPTBot or ClaudeBot. That is the most common newcomer pattern in this study: C2 passing, B2 failing. Add explicit AI crawler groups to robots.txt and scan again.
Why does my report say B1 is info instead of fail?
Content Signals is optional in the AIScan rubric, so a robots.txt with no Content-Signal line is recorded as info, not as a failure. It still costs you the points a pass would earn. Add a line such as Content-Signal: search=yes, ai-train=no, ai-input=yes with the values you actually mean.
AIScan says my llms.txt returns HTTP 404, but I uploaded one. What went wrong?
Usually the file is not at the site root. C2 requests /llms.txt on the scanned host, so a file under a subfolder, or on www when you scanned the bare domain, returns 404. Of the C2 failures in this study, most were a plain 404, not a blocked request. Open https://yoursite.com/llms.txt in a browser, fix the path, and scan again.
Why was September 2026 so much lower than the other months?
Partly because of batch scanning: 11 busy days in late August and September carried 565 first scans, many sent through the API. But the 99 hosts that arrived on September's quiet days passed llms.txt at 33.3%, no better than the busy days, so batches do not explain all of it. The cause of the rest is not visible in the scan data.
Is this the share of all websites with llms.txt?
No. These are sites somebody chose to scan with an AI-readiness tool, which skews toward owners already working on the problem. The study shows how that group changed month by month on one fixed rubric. It is not a crawl of the web.
How do I add llms.txt on WordPress?
ThinkRank writes llms.txt and robots.txt from one plugin and imports settings from Rank Math, Yoast, AIOSEO and SEOPress, so two plugins are not competing over one file. Yoast, Rank Math, AIOSEO and SEOPress also document llms.txt features of their own. Turn the feature on, confirm the file loads at /llms.txt, then scan.
How often will this study be repeated?
With the quarterly State of AI Agent Readiness update, on the same rubric while 2026.08.2 is current. A rubric change starts a new series, because a pass on a different rubric is a different test.

About the author
M Asif Rahman
Entrepreneur, curious about AI
I have been building companies for a long time, and lately most of my curiosity goes to AI. AIScan is a small personal project I built on a flight from Dubai to Narita. I use it to understand how ready the web is for AI agents, and I share what the scans teach me.
Related guides
AI readiness setup guide by platform (2026)
Verified 17, 18, 20 and 22 October 2026. Updated on 22 October 2026. An AIready site needs six things: a robots.txt that names AI crawlers D1, B2, a sitemap D2, a declared feed E5, an llms.txt C2,…
Yoast, Rank Math, AIOSEO or No SEO Plugin: What 212 WordPress Sites Give AI Agents
Direct answer: Across 212 WordPress homepages in our scan database on 20 November 2026, an SEO plugin made a clear difference on exactly the checks it has a feature for: JSONLD was present on 153 of…
Does llms.txt Actually Work in 2026? Google Ignores It, Chrome Audits It, 97% Get Zero Requests
Updated 15 November 2026 with a firstparty section on whether sites keep the file once they add it 527 hosts scanned twice. First published 26 August 2026. In June, Google added a line to its own AI…